App gallery / Money
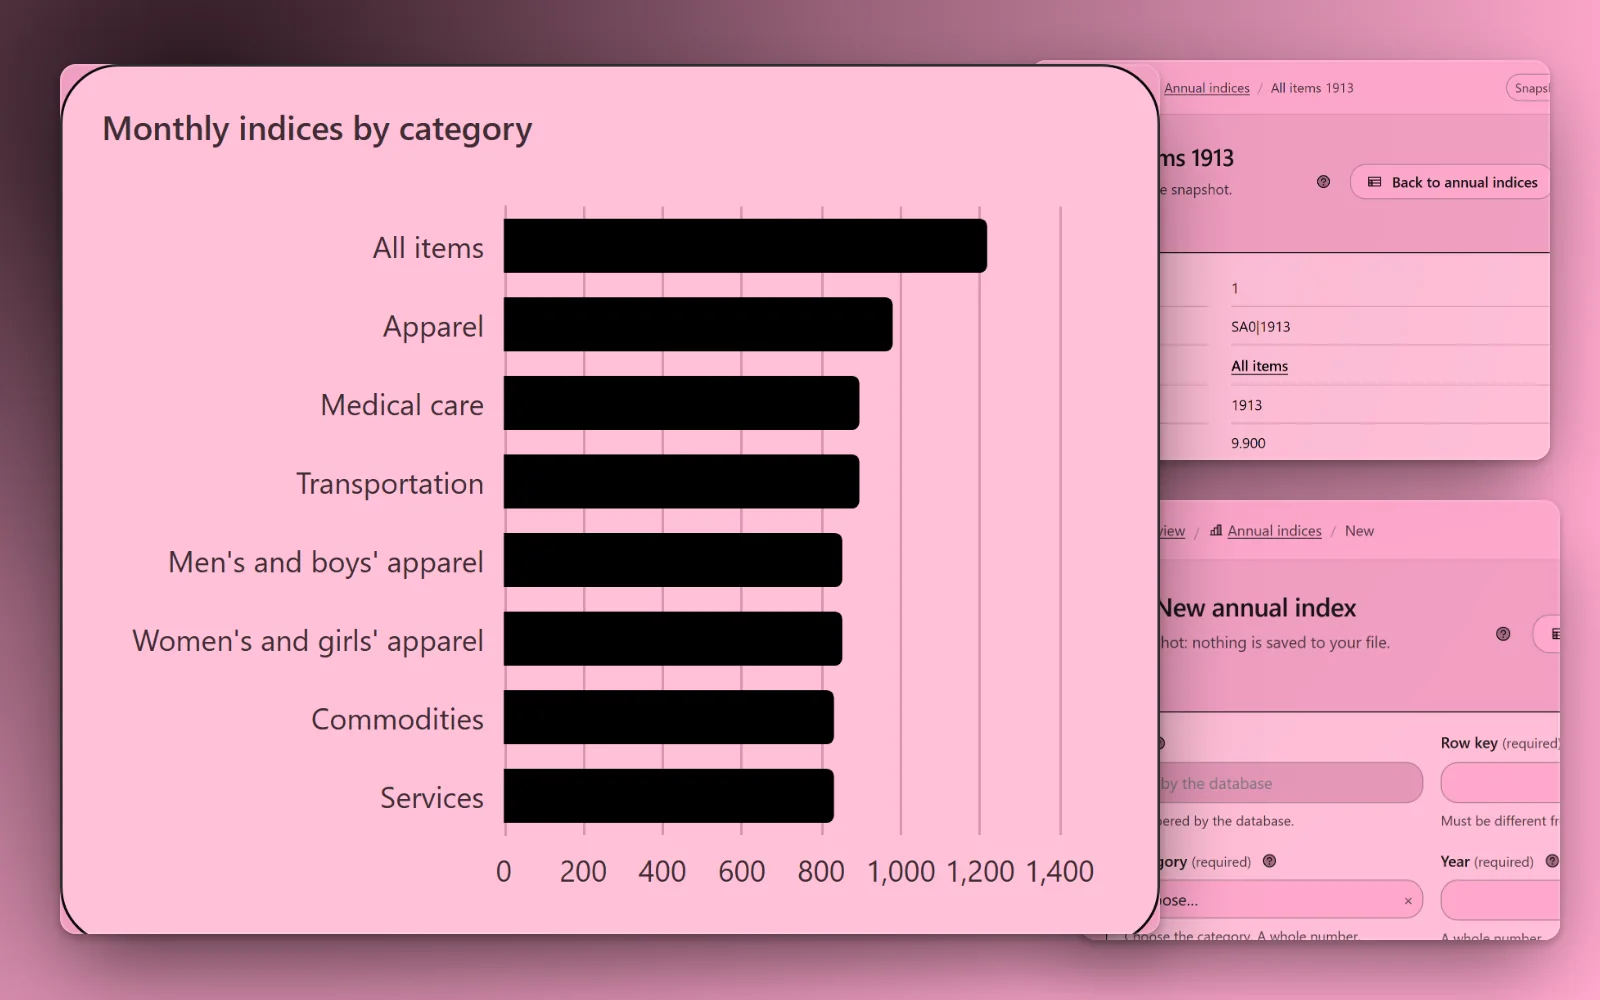
Shown in Soft Pink Bounce · 16 featured looks, 520+ more to choose from
Value of a dollar over time
The Consumer Price Index for All Urban Consumers (CPI-U), US city average, from the Bureau of Labor Statistics: every month since January 1913 and every year's average, for all items, and for the major groups (food and beverages, housing, apparel, transportation, medical care, recreation, education and communication, other goods and services, commodities and services) from the month BLS began each. Compare two dates to see what a dollar then is worth now, or which costs rose fastest.
Database app · 3 tables · design: Chartreuse Trading Dark
Making an app from a pack is for subscribers. Sign in
Tables
- categories5 columns · 13 rows in the full data
- monthly_index7 columns · 11,215 rows in the full data
- annual_index6 columns · 1,015 rows in the full data
Sources and licences
- BLS (Bureau of Labor Statistics) — Public domain (Free to use)
- Own packs (ours) — Ours (Free to use)
Shown in the app and its export: Consumer Price Index for All Urban Consumers (CPI-U), US Bureau of Labor Statistics (public domain), retrieved 2026-10-22.
Sample: the whole source. Full data: 12,243 rows, 12.1 MB. Measured 2026-10-22.
Data from www.bls.gov, imported 2026-10-22.
The full data, for your own database
12,243 rows, 121 KB to download. CreativePower keeps only the made-up sample rows in your project; load the full data into your own PostgreSQL database (Supabase works): download these files into one folder, unzip the .csv.gz files, then run psql "<your connection string>" -f load.sql.