App gallery / Travel
Shown in Aqua Workflow Dark · 16 featured looks, 520+ more to choose from
Airfare trends by route
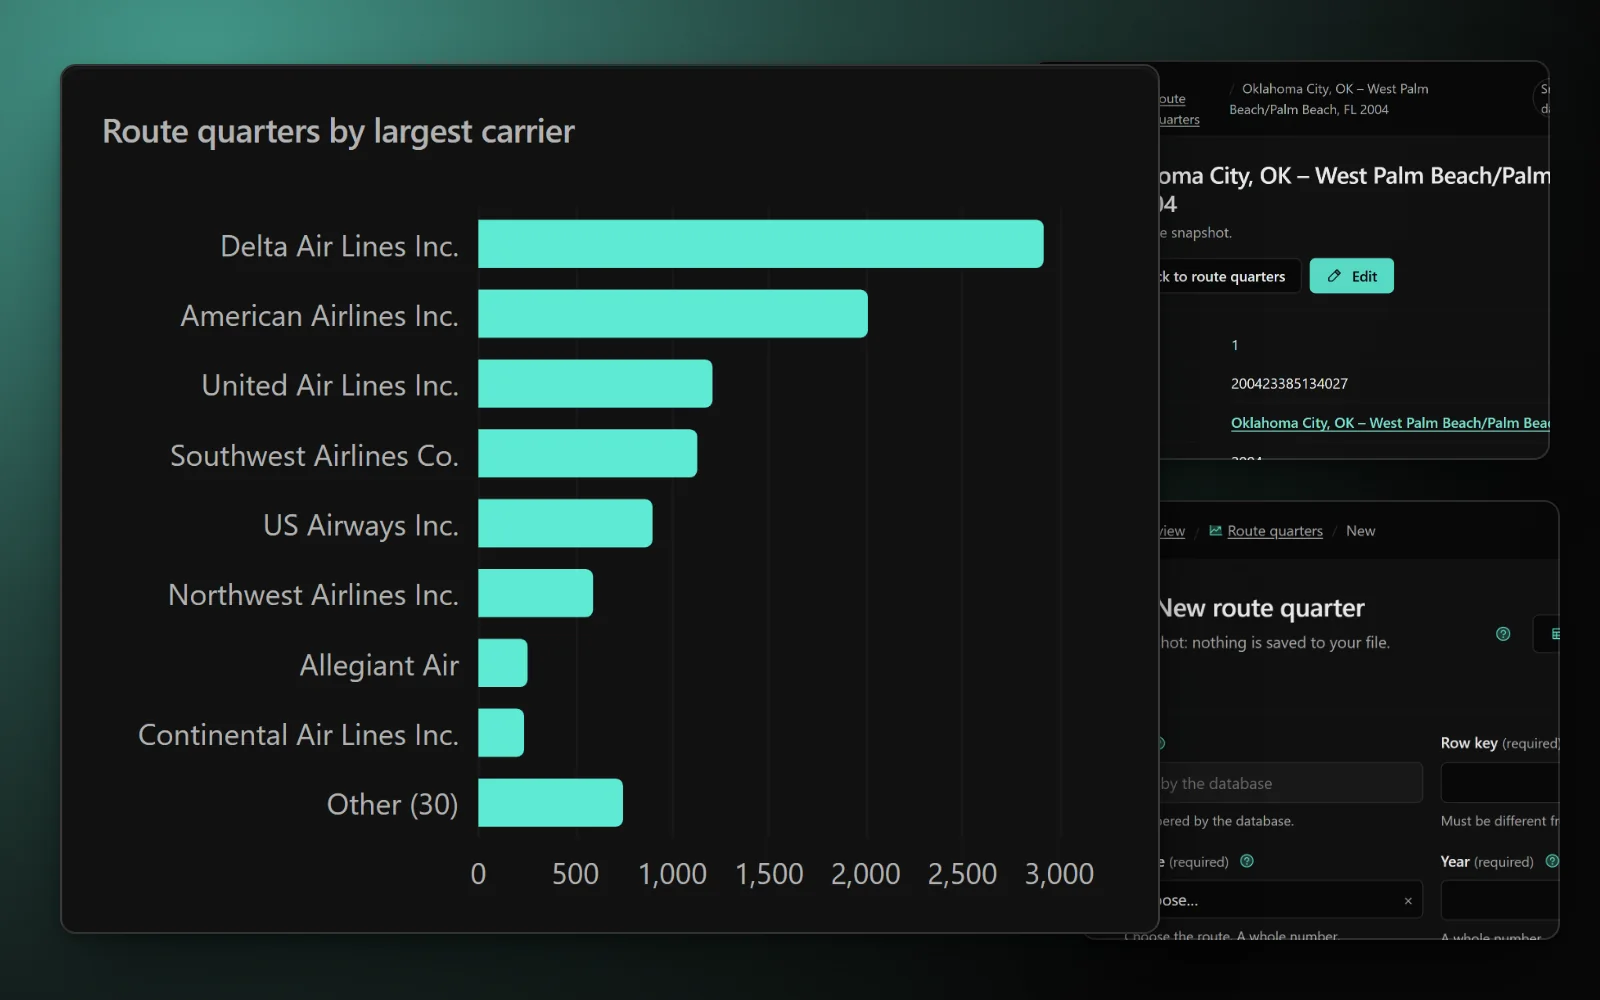
The US Department of Transportation's Consumer Airfare Report for every domestic city pair averaging at least 10 passengers a day (contiguous states). For each route and quarter: the average one-way fare, passengers per day, the airline with the largest share and its fare, and the airline with the lowest fare and its share. Follow a route's fares over thirty years, compare routes of similar distance, or see where a low-cost airline moved in. These are historical averages of fares paid, not live prices: use them to judge whether a fare is good, not to book.
Database app · 4 tables · design: Aqua Workflow Dark
Making an app from a pack is for subscribers. Sign in
Tables
- carriers3 columns · 1,779 rows in the full data
- cities3 columns · 404 rows in the full data
- routes6 columns · 10,061 rows in the full data
- route_quarters15 columns · 669,547 rows in the full data
Sources and licences
- BTS average airfares (DB1B) — US government, public domain (Free to use)
- Own packs (ours) — Ours (Free to use)
- BTS airline on-time data — Public domain (Free to use)
Shown in the app and its export: Domestic Airline Consumer Airfare Report, Table 6, US Department of Transportation, Office of the Assistant Secretary for Aviation and International Affairs (from BTS DB1B data; public domain), and the BTS carrier code list, retrieved 2026-10-22. Historical average fares, not live prices.
Sample: the whole source. Full data: 681,791 rows, 112 MB. Measured 2026-10-22.
Data from www.transportation.gov, imported 2026-10-22.
The full data, for your own database
681,791 rows, 22.3 MB to download. CreativePower keeps only the made-up sample rows in your project; load the full data into your own PostgreSQL database (Supabase works): download these files into one folder, unzip the .csv.gz files, then run psql "<your connection string>" -f load.sql.